
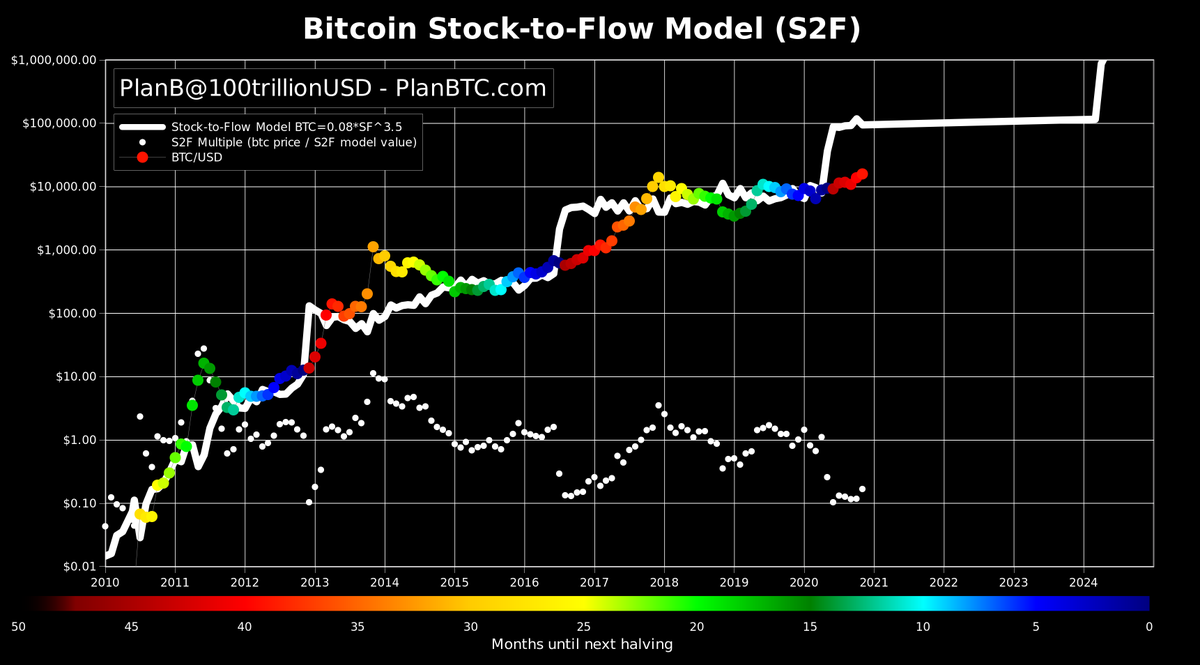
Chart update of the #bitcoin S2F (time series only) model.
Price dots moving nicely towards model line.
S2F multiple (white dots) rising.
Translations:
https://medium.com/@100trillionUSD/modeling-bitcoins-value-with-scarcity-91fa0fc03e25
To fully understand the structural dynamics of digital scarcity, macro analysts frequently rely on the Bitcoin Stock-to-Flow Model (S2F), a pioneering predictive framework published in March 2019. The model was introduced to the financial world by a pseudonymous Dutch institutional investor and quantitative analyst known simply as PlanB. For years, this model has been heavily utilized by hedge fund managers, quantitative traders, and long-term retail investors who seek to quantify Bitcoin's value proposition not as a speculative tech stock, but as a monetary commodity. By applying traditional mathematical principles to the digital realm, the S2F model became the first systematic attempt to prove that Bitcoin's long-term market capitalization is directly correlated to its programmatically enforced supply schedule.
The core methodology of the S2F model is borrowed from traditional commodities trading, where it has long been used to evaluate the scarcity and value of precious metals like gold and silver. The calculation relies on a simple mathematical ratio: the "Stock" represents the total existing supply of Bitcoin that has already been mined and is currently in circulation, while the "Flow" represents the annual production of new Bitcoins entering the market through mining. By dividing the stock by the flow, you obtain a number that represents the exact number of years required, at the current production rate, to replicate the existing supply. A higher stock-to-flow ratio indicates extreme scarcity, meaning the asset is highly resistant to supply inflation, which historically drives its long-term market value upward.
What makes this model incredibly interesting to the reader is how it interacts with Bitcoin's programmatic halving events. Every four years, the network automatically cuts the block reward given to miners in half, instantly cutting the "Flow" in half and doubling the Stock-to-Flow ratio. Before the first halving, Bitcoin behaved like a base metal, but with each successive halving, its ratio has jumped exponentially. By the mid-2020s, these halving events pushed Bitcoin's stock-to-flow ratio beyond that of gold, making it mathematically the scarcest monetary asset in human history. The model plots a smooth, upward-stepping line based on these supply shocks, and historically, Bitcoin's actual market price has gravity-bonded with this line, orbiting it through intense bull runs and severe bear market corrections.
Furthermore, PlanB later expanded this concept into the Stock-to-Flow Cross Asset Model (S2FX), which removed time from the equation and compared Bitcoin directly to silver, gold, and real estate based purely on scarcity phase transitions. This evolution showed that as an asset transitions through different stages of adoption from a mere proof of concept to a financial asset its valuation model shifts dramatically. For the reader, analyzing these models offers a fascinating perspective on how mathematical certainty can coexist with highly volatile financial markets, offering a long-term structural anchor that looks past the daily chaos of the order books.
Ultimately, it is vital to remember that there are many different technical, fundamental, and on-chain tools available to perform these macro market analyses, and no single model should ever be trusted blindly. The Stock-to-Flow model is an excellent theoretical framework for understanding the economic power of absolute scarcity, but savvy market participants must possess the skill to read between the lines and continuously verify their findings across multiple data points. Cross-referencing this supply-side model with demand-side metrics, regulatory updates, and global macroeconomic conditions is essential to confirm whether the observed metrics and trends are actually following their expected course or if the model's predictive power has begun to diverge from market realities.
